Response time is the total time it takes for a vehicle driver to perceive, evaluate, decide and react to a situation on the roadway. Since vehicle driver response time can be as long as 2-4 seconds, highway designers, accident reconstructionists and the courts take this into account. A highway designer allows several seconds of unobstructed view of a traffic control sign, giving time for the motorist to respond to the sign information. An accident reconstructionist utilizes response time to explain why an accident occurred, i.e., a bicyclist suddenly pulled in front of an automobile, giving insufficient time for the motorist to respond and avoid the accident. The courts are interested in apportioning liability to various parties in a legal action based on response time. At issue, of course, is the question, "Was there sufficient time to avoid an accident?" Claims professionals deal with this issue on a daily basis. Claimants often argue that the insured caused an accident by giving little time to respond. Other losses involving personal injury and property may be a consequence of a vehicle traveling at a high rate of speed leaving insufficient time to respond to road situations.
Like many other human characteristics, response time is a highly variable quantity. For the same road hazard, the response time of vehicle drivers varies markedly as a function of age, time of day, weather conditions, chemical ingestion, and fatigue. For a given driver, response times vary depending on type of hazard.
WHAT IS RESPONSE TIME
The studies of psychology and ergonomics have delved into the intricacies of how a person responds to stimuli. Current thought considers response time to be a summation of times required to activate biological functions. For instance, if one views a hazard on a roadway, there is a time required for conversion of the optical image into a nerve impulse, time to transmit a signal along a nerve to the cerebral cortex, time for processing of the signal by the brain, time for transmission of a signal along a nerve to musculature and time delay of muscle response. The sum total of these times is often called the response time, a term often confused with reaction time.
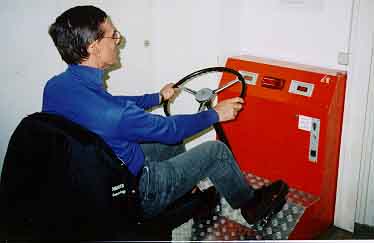
Figure 1
Response time = Perception/Decision Time + Reaction Time
The perception/decision time is the time it takes to view a hazard and figure out what to do about it. The reaction time is the time it takes to perform a particular function once a decision has been made. The response time for removing one's hand from a hot skillet is relatively quick and is on the order of about a half second. In this example, a natural response to excessive heat bypasses the visual sensors, allowing for a quicker response time. Driving an automobile requires a high degree of visual processing, which tends to extend response times.
McGee et. al. (1) reported that perception time is the sum of eye movement time, fixation on the hazard time delay, recognition time delay and muscle response delay time. They found that for the 85th percentile of drivers, eye movement delay was 0.09 seconds, fixation delay time was 0.20 seconds, recognition delay time was 0.50 seconds, decision time 0.85 seconds, muscle response delay was 0.31 seconds and brake reaction time was 1.24 seconds. The sum total of these times, the response time, was 3.19 seconds. The 85th percentile is often chosen as the upper bound for design analyses.
Many such studies assume that each of the component times are additive to form the total response time. Some investigators report that in many situations, parallel processing occurs, indicating that some of the component activities may be occurring simultaneously, reducing the calculated response time. Also, the type of hazard being recognized plays a major role in response time. For instance many laboratory tests involve a person sitting at a vehicle simulator waiting for a light to signal when to press the brake pedal. This type of testing usually results in short response times since the participants know what to expect and are ready. Contrast this with a driver cresting a hill and viewing a semi-tractor trailer rig broken down in the right lane of traffic, in a no parking area without signals or markers deployed. At the time of initial visual fixation, it may not be obvious that the vehicle is not moving, which may extend the perception/decision time significantly.
USAGE OF RESPONSE TIME
Figure 2 is a view of an accident scene showing long tire marks and an impact point at an intersection. Vehicle number 2 had driven across the roadway and was struck by vehicle number 1. The tire marks of vehicle number 1 prior to impact measured 234 feet in length. The distance from the crest of the hill was 500 feet. The speed limit was 45 MPH. If vehicle number 1 had been traveling the speed
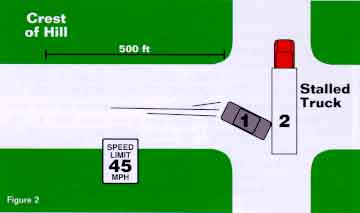
limit (45 MPH, 66 ft/sec), it would have taken approximately 7 seconds to reach the stalled truck, if no braking occurred. Being a clear day with ideal road conditions, a response time of 3 seconds would appear attainable. Consequently as vehicle number 1 crested the hill (assuming a 45 MPH speed), approximately 198 feet would be traveled before active braking occurred, with 302 feet left in which to stop. At a speed of 45 MPH, assuming a drag coefficient of 0.6 (a typical value for dry asphalt), the vehicle could be brought to a stop in approximately 114 feet, which is well within the 302 feet available. Therefore, if the vehicle had been traveling at the speed limit, the accident would have been avoidable. The 234 feet of tire mark suggests that the vehicle was traveling at a minimum of 64 MPH (94 ft/sec) at the beginning of the tire mark (again using a drag coefficient of 0.6). Assuming a response time of 3 seconds and a speed of 64 MPH, approximately 282 feet were traveled by vehicle number 1 before brake application occurred. The remaining distance of 218 feet was not sufficient to stop before contacting the stalled truck. Consequently, if the driver of vehicle number 1 had been traveling the speed limit, the accident probably would not have occurred. The stalled truck, crossing the intersection, is an obvious hazard and it can easily be seen that the vehicle is not moving.
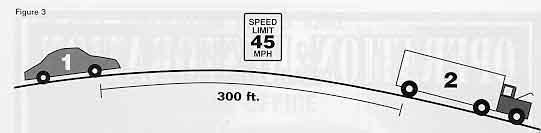
Figure 3 shows a slightly different scenario. A tractor trailer rig has broken down on a two lane highway with no markers or emergency lighting activated. The speed limit is 45 MPH. The distance from the crest of the hill to vehicle number 1 is 300 feet. From the rear, it is not obvious that the tractor trail is stalled since no markers or warnings are deployed. Using a response time of 3 seconds, vehicle number 1 would have traveled approximately 198 feet (at 45 MPH) before brake application leaving 102 feet remaining for stopping. The stopping distance at 45 MPH is approximately 114 feet, not enough distance to stop without impact with the truck. One may argue that a 3 second response time is excessive and that perhaps a 1.5 second response time is more realistic. However, the one complicating factor in this accident scenario is the non-obvious nature of the parked tractor trailer rig. Without warnings deployed, there may be difficulty in the determination of whether the vehicle is moving or not. This can significantly extend the perception time, such that a 3 second or higher response time would be reasonable.
OTHER INFLUENCES AFFECTING RESPONSE TIME
A little more skill is required to operate a motorcycle when compared to an automobile, consequently the separate licensing requirements in several states. In sudden hazardous situations, "slamming" on the brakes can have a detrimental effect, often causing the motorcycle to fall to one side or causing the operator to be catapulted over the handlebars. Consequently, application of the rear brake only is a prudent means of avoiding an accident when driving a motorcycle. The decision to use rear brakes only can increase response time. Also with only the rear brake being activated, the stopping distance increases since about 50% braking is being applied. What may be an appropriate response time and stopping distance for an automobile may not be appropriate for a motorcycle.
It has been well documented that visual functions decrease in proportion to decreasing illumination. Dirt on headlamps and crazing of windshields over time also aversely affect visual acuity. Headlight alignment greatly affects the perception of pedestrians as well as other vehicles.
A person's age affects response time with increases being most notable in the later years. An example of an age effect is the need for reading glasses or bifocal lenses. The growing inflexibility of the lenses in a person's eye causes this condition (presbyopia). Visual acuity typically peaks at about age 15 and declines to about 33% of the highest value at age 80 (Reference 2). The elderly have been found to be much more adversely affected due to their loss of acuity and other visual functions. Typical studies show reactions times of drivers near the age of 70 increase by approximately 20% over those for age 20 (Reference 3).
Chemical usage has been shown to have a substantial effect on response time. Reference 4 reports that at a blood alcohol content of 0.02% by weight, the average increase in errors in simulated driving is approximately 6 in the particular study. At a blood alcohol content of 0.08%, the average increase in errors in simulated driving is approximately 25 in this particular test. Therefore, the simulated driving error rate at 0.08% blood alcohol content was 4 times that at 0.02%, indicating that, despite the fact that a driver may have a blood alcohol level below a legal limit, there is still an effect on the response time.
Reference 5 reports that the average reaction time for women was approximately 15% longer than for men.
CLOSING
What can be gleaned from the previous discussion is that response time is a distributed quantity because of variability in people, as well as in situations that require a response. The accident reconstruction community often assumes a maximum 2.5 - 3.0 second response time. This may be applicable for most accidents with obvious hazards. Other accidents involving less defined or confusing hazards may result in longer response times. Other factors extending response time are age, time of day, gender and chemical usage, suggesting that response time is typically characteristic of a particular set of circumstances encountered in an accident.
REFERENCES
1. McGee, et. al., Highway Design and Operation Standards Affected by Driver Characteristics, Volume II: Final Technical Report, Bellomo-McGee, Inc. Vienna, Virginia, Report No. FHWA-RD-83-015, 1983.
2. Verriest, G., L'influence de l'age sur les fonctions visuelles de l'homme, Bulletin de L'Academe Royale de Medecine Bellique, 1971, 11, 527-578.
3. American Automobile Association, Traffic Engineering Safety Department, Age and Complex Reaction Time, Report No 41, 1952.
4. Barzelay and Lacy, Scientific Automobile Accident Reconstruction, Matthew Bender, New York, 1985.
5. American Automobile Association, Traffic Engineering Safety Department, Reaction Time as Related to Age, Report No. 69, 1966.
FOR TECHNICAL ARTICLES CONTACT CLAIMS MAGAZINE AND ASK
FOR A REPRINT OF A PAST TECHNICAL NOTEBOOK ARTICLE
CLAIMS MAGAZINE
BACK TO C. ROBERTS CONSULTING ENGINEERS HOME PAGE,
WWW.CROBERTS.COM
WWW.CROBERTS.COM