Minneapolis Bridge Collapse
By
Charles C. Roberts, Jr., PhD, PE
The disastrous collapse of the I35W Bridge in Minneapolis on August 1, 2007, has gripped the nation, not only because of the loss of life, but because of the questions it raises as to the integrity of other highway structures. Claims personnel who deal with both large and small losses are familiar with the aftermath procedure of attempting to determine the cause of the loss, or in this case, the collapse of the bridge. The National Transportation Safety Board (NTSB), the governmental agency tasked with transportation related investigations, has indicated that the findings as to the cause of the collapse will probably not be available for about a year, which is typical of large losses such as this. Data must be gathered, bridge sections in the Mississippi must be retrieved and failure analyses must be performed in order to arrive at a probable scenario on what caused the collapse. Despite the long time required for a full reconstruction of the accident, the internet is overflowing with failure analyses from a variety of sources, from non-scientific bloggers to college professors. In order to cut through the chatter, here is what is known at this time regarding the failure.
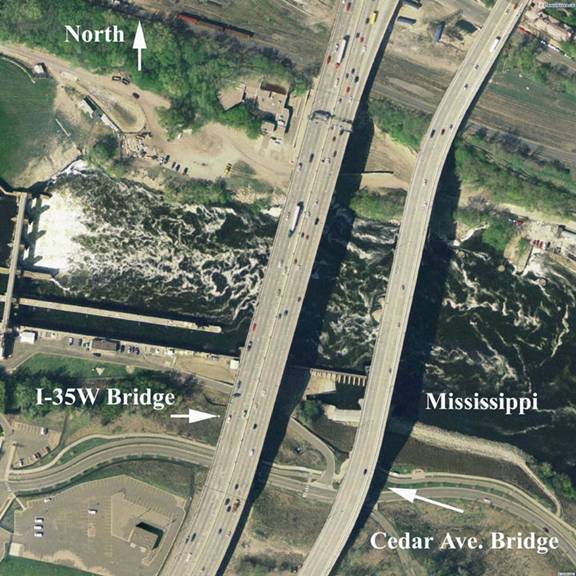
Figure 1 (Satellite Image, 4/15/2004)
Figure 1 is a satellite view of the bridge on April 15, 2004. Bridge construction started in 1964, and was completed in 1967. It had a total length of 1907 feet, with three lanes in each direction. The bridge was heavily traveled, carrying 140,000 vehicles daily. Due to its proximity to St. Anthony Falls to the west, the bridge receives constant moisture from the falls, which causes considerable driving difficulty in the winter. An automatic deicing system was installed in the bridge deck in 1999, using potassium acetate solution as the ice melting agent.
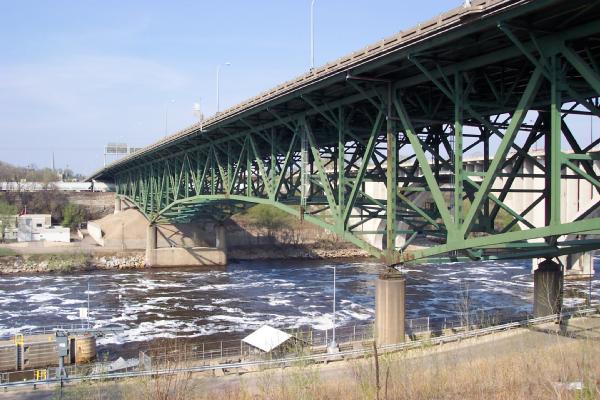
Figure 2 (Photo from Reference 1)
Figure 2 is a photograph of the bridge looking north that appeared in the bridge inspection report of Reference 1. On August 1, 2007 (6:05 pm) the bridge collapsed without warning. Figure 3 shows video frames from a security camera looking at the northwest elevation of the bridge. The south support piers are just out of view.
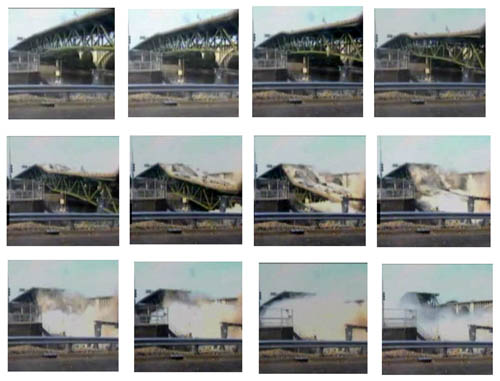
Figure 3 (surveillance camera video frames)
Large unstable deflections toward the south end of the bridge suggest that some critical bridge structural element failed in that area, causing the collapse.
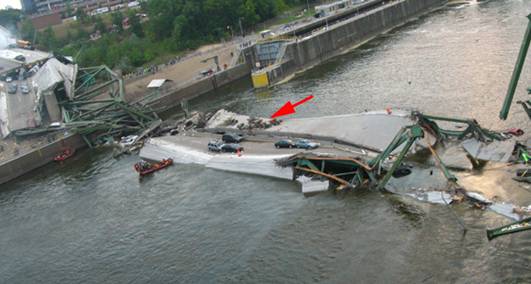
Figure 4 (Diversey’s Photos, Flickr)
Figure 4 shows the aftermath of the bridge viewed from the east side, looking south. Apparently, at the time of failure, construction work was being performed on the bridge in the southbound lanes. The arrow points to concrete mixing equipment and other construction trucks. There were reports of over 100 tons of gravel stored on the bridge in that area. Traffic had been diverted to the northbound lanes. Prior inspection reports (Reference 1) indicate that the bridge was in need of repair, with several references to corrosion, fatigue cracks and deformed members.
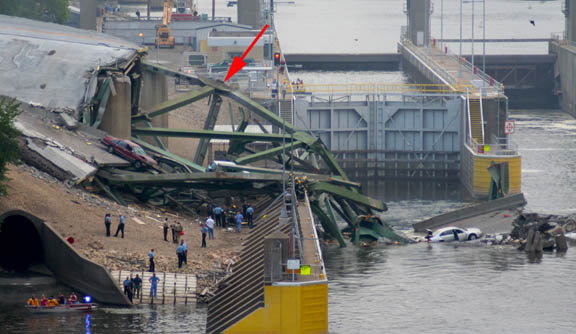
Figure 5 (Diversey’s Photos, Flickr)
Figure 5 is a view of the south end of the bridge, which is an area of interest because of the unsymmetrical deformation pattern to the bridge structure and the sequence of failure shown in the video clips of Figure 3. Soon after the failure, there were discussions by the NTSB of a possible design flaw and there was considerable interest in gusset plates (used to connect bridge structural members) (Arrow, Figure 5) because of reported metal fatigue: a cyclic loading phenomena which tends to drive cracks through steel structure over time. (See Reference 2)
So what is the likely cause of the collapse? There is insufficient information at this time to make a determination, but one can say, with certainty, that safety margin erosion played a significant role in the failure as explained in Figure 6.
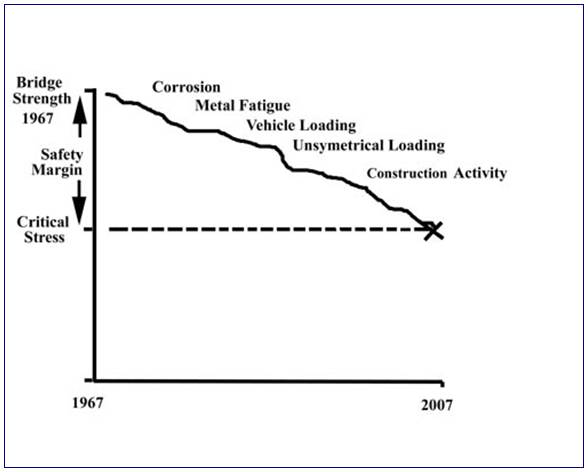
Figure 6
In 1964, the bridge was designed so that its strength far exceeded the critical stress or failure stress. The difference between the strength and critical strength is called the safety margin. The philosophy here is to build it stronger than necessary to account for unforeseen factors in the future. Over time, the bridge strength had deteriorated because of a variety of factors, some unknown at this time. At the time of failure, there was corrosion evident on the bridge, there were fatigue cracks in structural members and there were deformations to various structural elements (Reference 1). There was construction activity in the form of jack hammering operations, concrete mixing and storing of building materials. Traffic was being routed to the northbound lanes and the failure occurred at, or near, rush hour. The construction activity and rerouting of traffic are examples of unsymmetrical loading, which can affect a structure as shown in Figure 7. The 200 lb symmetrical load is stable, while the 100 lb unsymmetrical load is unstable, even though it is a lesser load.
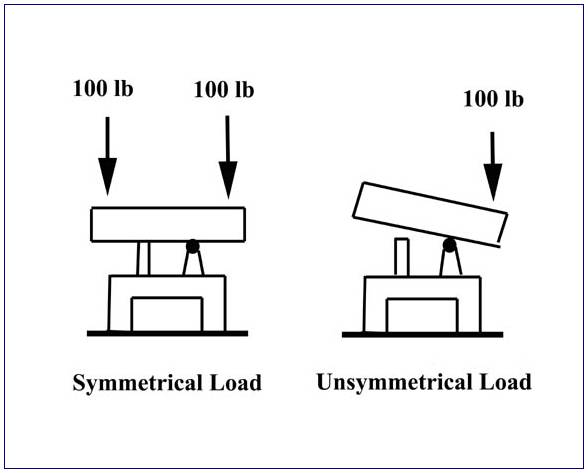
Figure 7
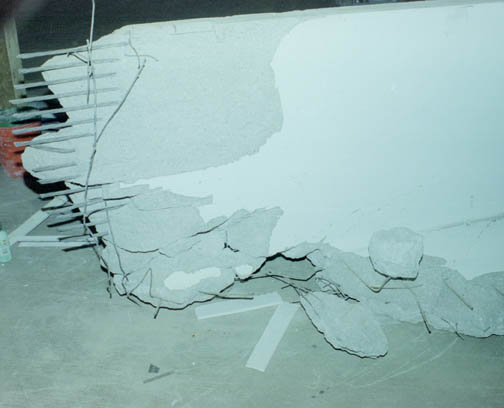
Figure 8
Figure 8 shows a failed reinforced concrete beam that allowed a floor to collapse at a large convention center. The center was being used for a flower show and sand was piled in one area on the floor, to be used in the flower displays. Sand, which can weigh up to 1.8 tons per cubic yard, overloaded the floor, causing the loss. Gravel can weigh up to 1.4 tons per cubic yard, with a mere 70 yards of gravel weighing 100 tons. The lesson here is that stored construction material may not be an insignificant load. Upon questioning by reporters, NTSB has remarked that construction loading did not cause the failure, which may be true. As in many failures, it is the accumulation of factors that lead up to the eventual failure of the structure as illustrated in Figure 6.
Truck weight limits have increased in recent years. In the mid 1970’s truck weight limits were 50,000 lbs; now they are 80,000 lbs. (Some states allow even higher weights.) Of course, these weight limits do not reflect overloaded trucks on the road. (Some estimates indicate that 30% of trucks are overloaded.) There are about 4 times as many heavy trucks on the road now, when compared to the mid 1970’s. This increase in vehicle weight has obviously reduced the safety margin, since load calculations were most likely based on earlier weight data.
In addition, design calculation methods of the 60’s lacked modern computer based techniques such as finite element and finite difference analysis, which yield relatively accurate modeling of stress in structural members. Earlier, less accurate design methods could have lead to a design flaw in the structure.
NTSB has alerted other states to be careful of construction related loading on other bridges. Special emphasis is being placed on “fracture critical” bridges that can collapse if one of the truss members fail, as occurred in this case.
The investigation continues…
References:
1. “Fracture Critical Bridge Inspection, Bridge # 9340, I-35W over the Mississippi River at Minneapolis, MN,” June 2006, Minnesota Department of Transportation.
2. “Metal Fatigue,” Insurance Adjuster, March 1983.