EVOLUTION OF AUTOMOBILE ACCIDENT
RECONSTRUCTION
(Published in Subrogator
Magazine, Fall 2007)
By
Charles C. Roberts, Jr., Ph.D., P.E.
In the “old days,” automobile
accident reconstruction testimony was often offered with little scientific or
computational basis. Controlled (expert) witnesses would offer estimates of
impact speed based on, for example, years of experience as a police officer
attending to actual automobile accidents.
With the advent of more scientific approaches where calculations are rooted
in laws of physics, accident reconstruction has evolved into a more scientific
methodology utilizing computers for calculations (Ref 1) and instruments for
testing automotive vehicles. Still, some jurisdictions gave more weight to
eyewitness testimony speed estimates of a vehicle than to speeds determined by
scientific means (Ref 2). An eyewitness
may be able to testify that a vehicle was traveling in a certain direction, but
is unlikely to offer accurate testimony as to the speed of the vehicle. Over time, the courts have come to realize
that scientific means have evolved in accuracy and can help the trier of fact.
Consequently, accident reconstruction analysis, which is scientifically based,
is now typically allowed in court, despite the existence of eyewitness
testimony. This article reviews what has changed and what remains
the same in accident reconstruction over the years.
Accident Scene Investigation
Classically,
accident scenes have been documented by film cameras and tape measurements. The
accident reconstructionist walks the scene, takes
measurements and documents on paper. With the evolution of inexpensive digital
technology, digital cameras have displaced the film camera, and electronic theodolite
(transit) measuring is beginning to displace manual measurements. For example, Figure 1 is a diagram of an
accident scene measured by an electronic transit, generated from total station
software. Total station is a measuring device used by land surveyors, but is
now being used by police departments and investigators to document accident
scenes. The instrument uses a light beam to measure objects at the scene and
converts this information to x, y and z coordinates. The data is then
downloaded to a CAD program for scene drawings and calculation purposes. There
are over 100 data points measured with the total station to generate the scene
diagram of Figure 1.
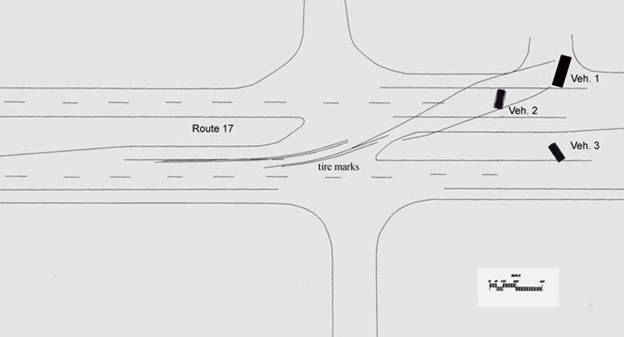
Figure 1
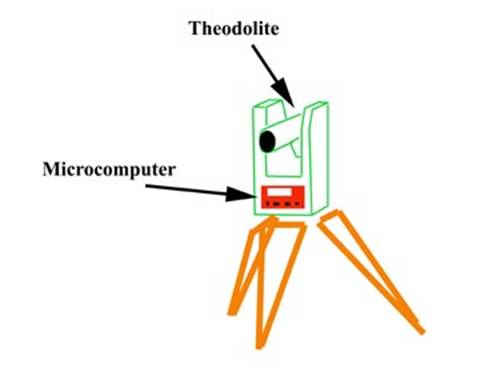
Figure 2
Figure 2 shows a drawing of a
typical theodolite with microcomputer measuring device and optical viewing
scope. The operator typically has a hand held device to download data from the
theodolite, to be used in the analysis. The advantage of the new technology is
more accuracy, more data points and less measurement time.
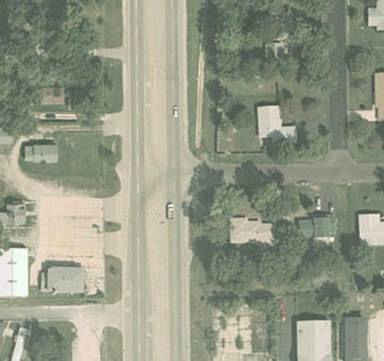
Figure 3
Another aid in analyzing the
accident scene is the availability of relatively high resolution satellite
imaging, as shown by the satellite photo of Figure 3. Resolutions on the order
of one foot can be purchased for many areas in the
Vehicle Inspection and Analysis
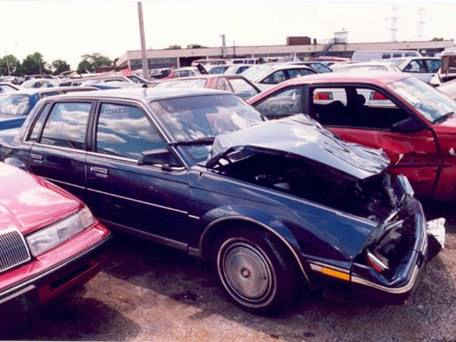
Vehicle damage pattern
analysis has always been an important aspect of accident construction and will
continue to be utilized in the future. The damage patterns help determine orientation of vehicles at impact and severity of
the impact. Some new technology that is
helping the reconstructionist, is the onboard data recording
technology available now in many new vehicles.
This includes the sensing diagnostic module for air bag deployment
(black box) as well as onboard trouble records in vehicle memory. Figure 4
shows a typical black box (they are actually silver), indicated by the arrow, being
downloaded to a lap top computer.
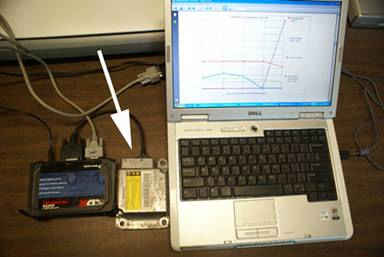
Figure 4
In this instance, the black
box was removed and connected directly to the computer because of severe damage
to the main vehicle electronic bus system. Many times, the data can be extracted
without removing the black box. Data
extracted from the black box includes vehicle speed, seat belt usage and
velocity change: a measure of the severity of the accident. See Reference 3 for
an article detailing black box technology. With the advent of anti-lock brakes
on vehicles, tire skid marks are less apparent, since the antilock brake system
is designed to reduce skidding. It is becoming more difficult for analysts to
measure these faint tire marks especially several days after the accident. The
black box speed data has evolved at the right time to offset this loss of data.
Other onboard data is
available through more advanced diagnostic tools (Figure 5) that store fault
codes on various processors throughout the vehicle. The tool is connected to
the DBR2 port on the vehicle and downloads information stored onboard the
vehicle. This information can give insight into the mechanical and electrical
condition of the vehicle and possibly signal the existence of a defective
condition in the vehicle that could have caused an accident.
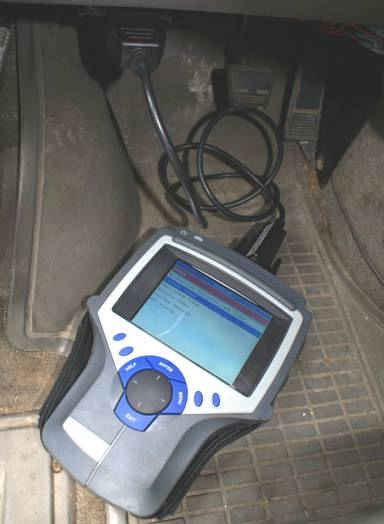
Figure 5
Figure 6 is an example of
another electronic testing device, a brake performance analyzer. Mounted on the
dash, the vehicle is tested to determine if braking performance of a vehicle is
adequate. Data read-out is in G’s of
deceleration, or drag factor.
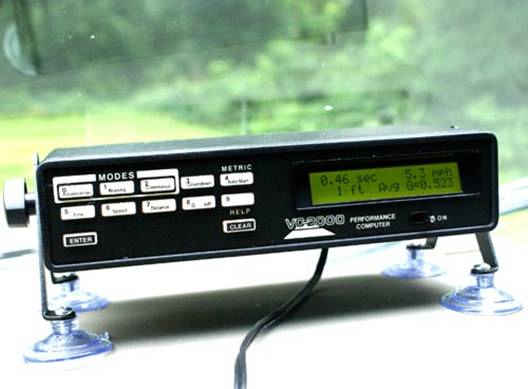
Figure 6
The Reconstruction
Hand calculations using
equations derived from scientific physical laws are still used in
reconstruction. However the proliferation of inexpensive computer technology
has spawned a variety of computer programs used
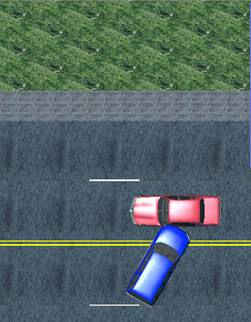
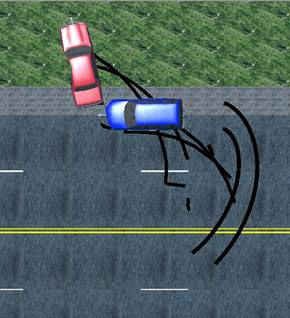
Figure 7a
Figure 7b
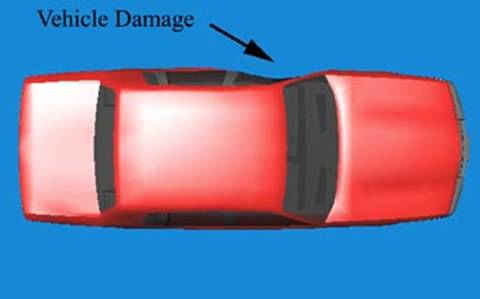
Figure 7c
to calculate impact speeds and provide simulations of
the accident. Figure 7a shows impact
positions of two vehicles involved in an accident. Figure 7b shows the rest positions of the
vehicles, determined by scene data. The hypothesized impact and speed
conditions are input into the computer, and the results reviewed (Figure 7b).
If the rest positions from the calculation match the positions documented at
the scene, then the input data is most likely the impact speed and orientation
of the vehicles. Figure 7c shows vehicle
crush or damage calculated by the program. This is compared to the actual
damage to the vehicle as a measure of the accuracy of the calculations. The
program shown above uses the SMAC (Simulation Model of Automotive Collision) computer
analysis developed by the National Highway Traffic Safety Administration.
Simulations can then generate animations. These are short videos of how the
accident occurred, which are good demonstrative evidence for a jury. The
computer programs utilize the same basic laws of physics as do the hand
calculations but are more rapid and many times more accurate. It should be
noted that the computer is not offering an opinion as to speed or impact orientation.
It is the reconstructionist
who offers the opinion based on scientific data and analysis tools (computer)
commonly used in the scientific community.
Accident reconstruction has
evolved and is adapting to new technologies. The once prolific skid mark has
been slowly disappearing because of anti-lock brakes, which leave little or no
tire mark. Black box data showing
pre-impact speed has replaced some of this information as software becomes
available to access this information. Despite all these new and improved tools
that are available,
the reconstrutionist is still the
ultimate formulator of opinions offered in court as to how an accident
occurred. Other articles that concern
accident reconstruction and may be of interest are outlined in References 4-8.
References:
1.
"Computerized
Accident Reconstruction," Insurance Adjuster Magazine, June 1983, p50f.
2.
Colonial Trust and
Savings Bank v. Kasmar, et al. Third District No-3-89-0034,
3.
“Black Box Aids
in Subrogation,” Subrogator, Spring/Summer 2004,
p104f.
4.
"Automotive
Lamp Examination," Insurance Adjuster Magazine, February 1984, p42f.
5.
"Response
Time," Claims Magazine, June 1998, p30f.
6.
"The
Anti-Lock Effect," Claims Magazine, March 1994, p69f.
7.
"Damage
Patterns on Vehicles Reveal Much for Accident Reconstruction," Claims
Magazine, June 1996, p36f.
8.
"Truck
Accidents - Investigating Probable Cause," Insurance Adjuster Magazine,
October 1985, p43f.